

MENLO PARK, Calif., March 6, 2024 /PRNewswire/ -- Cyngn Inc. (the "Company" or "Cyngn") (Nasdaq: CYN) today announced its financial results for the fourth quarter and year ending on December 31, 2023.
Recent Operating Highlights:
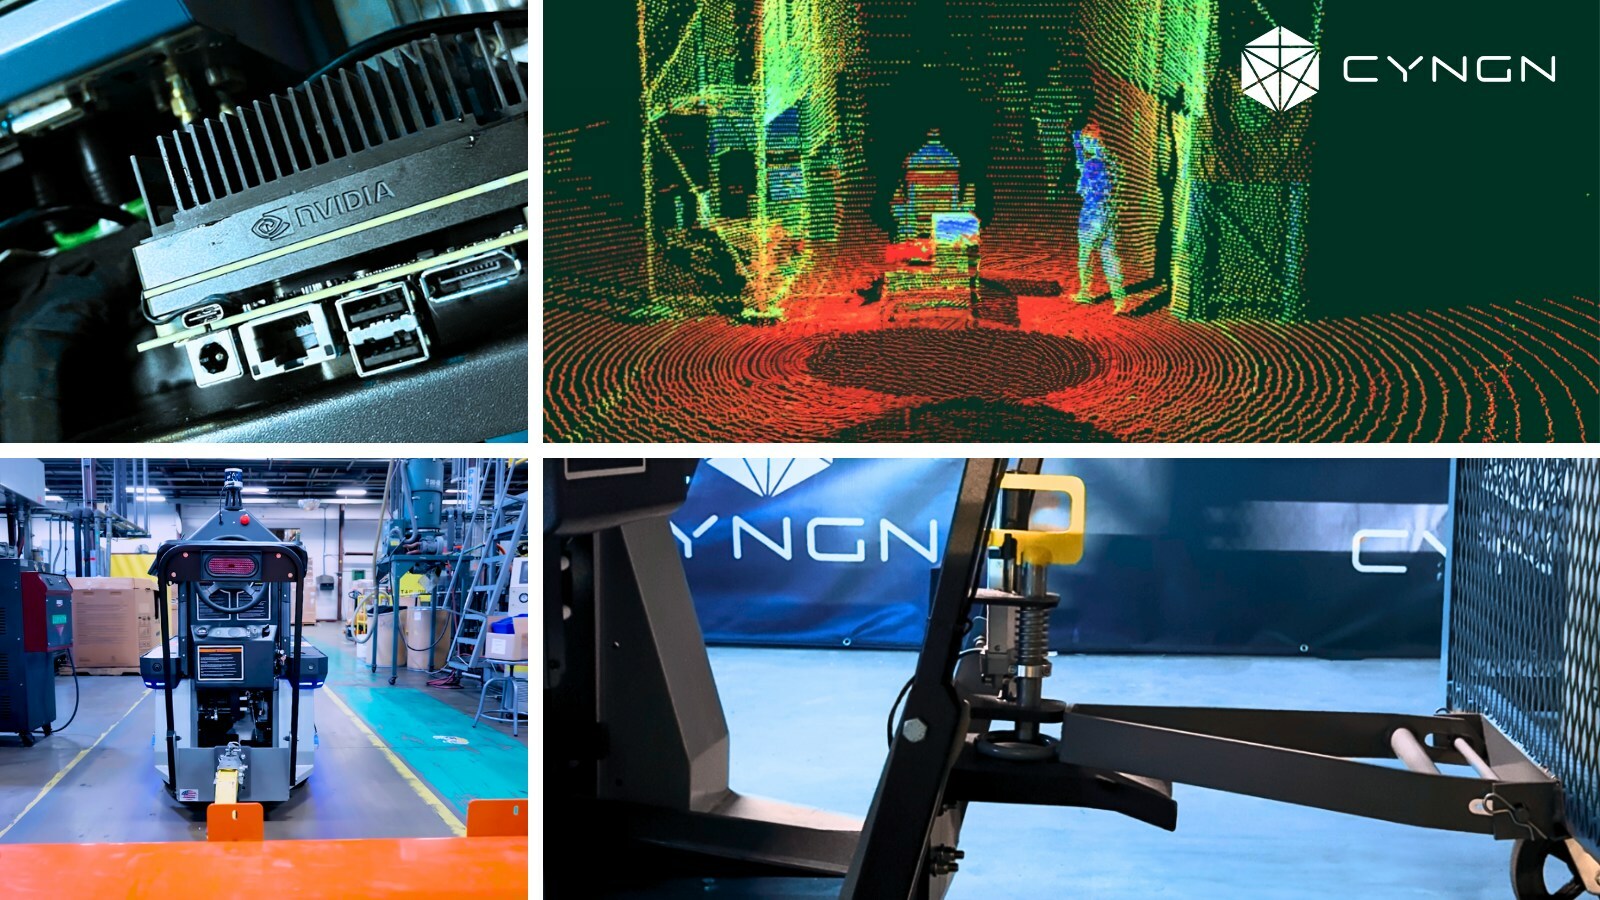
"I am pleased with the accomplishments of our Cyngn team as we transitioned from years of R&D into 2023 commercial readiness and finished the year with annual revenue at $1.5 million," said Lior Tal, Chairman and Chief Executive Officer of Cyngn. "Our success is also driven in part with our key leading OEM partnerships from Motrec and BYD, and, aided by our technology alignment with Ouster's LiDAR sensors and Nvidia's artificial intelligence computation capabilities that power Cyngn's AI-driven autonomous vehicle software solutions. During the first couple of months of 2024 we already successfully completed multiple trial deployments of DriveMod Autonomous Vehicles with leading vehicle manufacturers and automotive suppliers, and anticipate 2024 to be a fast-paced and exciting year as these transition to follow-on sales, and we scale up production deployment and rapidly expand our customer installed base. This will happen in parallel to continued development of the DriveMod Autonomous Forklifts, which are expected to begin initial deployments during the second half of the year."
To learn more, watch our 2023 year in review video here.
2023 Financial Review:
Q4 2023 Financial Review:
Balance Sheet Highlights:
Cyngn's unrestricted cash and short-term investments at the end of 2023 total $8.2 million compared to $22.6 million as of December 31, 2022. At the end of the same period, working capital was $7.4 million and total stockholders' equity was $10.6 million, as compared to year-end working capital of $22.4 million and total stockholders' equity of $24.1 million, respectively as of December 31, 2022. The Company had no debt as of December 31, 2023 and December 31, 2022.
For more information on Cyngn, visit the "Investor Relations" page of the Company's website (https://investors.cyngn.com/).
About Cyngn
Cyngn develops and deploys scalable, differentiated autonomous vehicle technology for industrial organizations. Cyngn's self-driving solutions allow existing workforces to increase productivity and efficiency. The Company addresses significant challenges facing industrial organizations today, such as labor shortages, costly safety incidents, and increased consumer demand for eCommerce.
Cyngn's DriveMod Kit can be installed on new industrial vehicles at end of line or via retrofit, empowering customers to seamlessly adopt self-driving technology into their operations without high upfront costs or the need to completely replace existing vehicle investments.
Cyngn's flagship product, its Enterprise Autonomy Suite, includes DriveMod (autonomous vehicle system), Cyngn Insight (customer-facing suite of AV fleet management, teleoperation, and analytics tools), and Cyngn Evolve (internal toolkit that enables Cyngn to leverage data from the field for artificial intelligence, simulation, and modeling).
Find Cyngn on:
Website: https://cyngn.com
Twitter: http://twitter.com/cyngn
LinkedIn: https://www.linkedin.com/company/cyngn
YouTube: https://www.youtube.com/@cyngnhq
Investor/Media Contact: Bill Ong, This email address is being protected from spambots. You need JavaScript enabled to view it.; 650-204-1551
Forward-Looking Statements
This press release contains forward-looking statements within the meaning of the Private Securities Litigation Reform Act of 1995, Section 27A of the Securities Act of 1933, as amended, and Section 21E of the Securities Exchange Act of 1934, as amended. Any statement that is not historical in nature is a forward-looking statement and may be identified by the use of words and phrases such as "expects," "anticipates," "believes," "will," "will likely result," "will continue," "plans to," "potential," "promising," and similar expressions. These statements are based on management's current expectations and beliefs and are subject to a number of risks, uncertainties and assumptions that could cause actual results to differ materially from those described in the forward-looking statements, including the risk factors described from time to time in the Company's reports to the SEC, including, without limitation the risk factors discussed in the Company's annual report on Form 10-K filed with the SEC on March 7, 2024. Readers are cautioned that it is not possible to predict or identify all the risks, uncertainties and other factors that may affect future results No forward-looking statement can be guaranteed, and actual results may differ materially from those projected. Cyngn undertakes no obligation to publicly update any forward-looking statement, whether as a result of new information, future events, or otherwise.
CYNGN INC. AND SUBSIDIARIES | ||||||
CONSOLIDATED STATEMENT OF OPERATIONS | ||||||
(Unaudited) | ||||||
Three Months Ended December 31, | ||||||
2023 | 2022 | |||||
Revenue | $ | 40,356 | $ | 262,000 | ||
Costs and expenses: | ||||||
Cost of revenue | 100,589 | 186,823 | ||||
Research and development | 3,022,884 | 2,818,599 | ||||
General and administrative | 2,312,843 | 2,947,394 | ||||
Total costs and expenses | 5,436,316 | 5,952,816 | ||||
Loss from operations | (5,395,960) | (5,690,816) | ||||
Other income, net | ||||||
Interest income | 39,189 | 41,409 | ||||
Other income (expense) | (790) | 103,262 | ||||
Total other income, net | 38,399 | 144,671 | ||||
Net loss | $ | (5,357,561) | $ | (5,546,145) | ||
Net loss per share attributable to common | $ | (0.12) | $ | (0.15) | ||
Weighted-average shares used in computing | 46,005,620 | 37,654,019 | ||||
CYNGN INC. AND SUBSIDIARIES | ||||||
CONSOLIDATED STATEMENT OF OPERATIONS | ||||||
Year ended | ||||||
December 31, | ||||||
2023 | 2022 | |||||
Revenue | $ | 1,489,317 | $ | 262,000 | ||
Costs and expenses: | - | |||||
Cost of revenue | 1,222,321 | 186,823 | ||||
Research and development | 12,719,983 | 9,481,329 | ||||
General and administrative | 10,892,955 | 9,994,575 | ||||
Total costs and expenses | 24,835,259 | 19,662,727 | ||||
Loss from operations | (23,345,942) | (19,400,727) | ||||
Other income, net | ||||||
Interest income | 137,887 | 44,100 | ||||
Other income | 396,825 | 120,118 | ||||
Total other income , net | 534,712 | 164,218 | ||||
- | ||||||
Net loss | $ | (22,811,230) | $ | (19,236,509) | ||
Net loss per share attributable to common | $ | (0.57) | $ | (0.55) | ||
Weighted-average shares used in computing net | 39,987,864 | 34,947,710 | ||||
CYNGN INC. AND SUBSIDIARIES | ||||||
CONSOLIDATED BALANCE SHEETS | ||||||
December 31, | December 31, | |||||
2023 | 2022 | |||||
Assets | ||||||
Current assets | ||||||
Cash | $ | 3,591,623 | $ | 10,536,273 | ||
Restricted cash | - | 50,000 | ||||
Short-term investments | 4,561,928 | 12,064,337 | ||||
Prepaid expenses and other current assets | 1,316,426 | 1,126,137 | ||||
Total current assets | 9,469,977 | 23,776,747 | ||||
Property and equipment, net | 1,486,672 | 884,000 | ||||
Right-of-use asset, net | 992,292 | 371,189 | ||||
Intangible assets, net | 1,084,415 | 473,076 | ||||
Total Assets | $ | 13,033,356 | $ | 25,505,012 | ||
Liabilities and Stockholders' Equity | ||||||
Current liabilities | ||||||
Accounts payable | $ | 196,963 | $ | 155,943 | ||
Accrued expenses and other current liabilities | 1,201,142 | 854,920 | ||||
Current operating lease liability | 682,718 | 376,622 | ||||
Total current liabilities | 2,080,823 | 1,387,485 | ||||
Non-current operating lease liability | 317,344 | |||||
Total liabilities | 2,398,167 | 1,387,485 | ||||
Commitments and contingencies (Note 12) | ||||||
Stockholders' Equity | ||||||
Common stock, Par $0.00001; 200,000,000 shares authorized, | 648 | 337 | ||||
Additional paid-in capital | 170,652,160 | 159,847,229 | ||||
Accumulated deficit | (160,017,619) | (135,730,039) | ||||
Total stockholders' equity | 10,635,189 | 24,117,527 | ||||
Total Liabilities and Stockholders' Equity | $ | 13,033,356 | $ | 25,505,012 | ||
CYNGN INC. AND SUBSIDIARIES | ||||||
CONSOLIDATED STATEMENT OF CASH FLOWS | ||||||
Year Ended | ||||||
December 31, | ||||||
2023 | 2022 | |||||
Cash flows from operating activities | ||||||
Net loss | $ | (22,811,230) | $ | (19,236,509) | ||
Adjustments to reconcile net loss to net cash used in operating | ||||||
Depreciation and amortization | 961,281 | 604,871 | ||||
Stock-based compensation | 3,208,103 | 2,867,698 | ||||
Realized gain on short-term investments | (443,392) | (90,216) | ||||
Changes in operating assets and liabilities: | ||||||
Prepaid expenses and other current assets | (1,403,049) | (1,425,126) | ||||
Accounts payable | 41,020 | 43,672 | ||||
Accrued expenses and other current liabilities | 969,662 | 936,387 | ||||
Net cash used in operating activities | (19,477,605) | (16,299,223) | ||||
Cash flows from investing activities | ||||||
Purchase of property and equipment | (1,045,822) | (918,318) | ||||
Acquisition of intangible asset | (718,711) | (456,822) | ||||
Purchase of short-term investments | (21,573,199) | (27,000,000) | ||||
Proceeds from maturities of short-term investments | 29,519,000 | 15,025,879 | ||||
Disposal of assets | 180,898 | - | ||||
Net cash provided by (used in) investing activities | 6,362,166 | (13,349,261) | ||||
Cash flows from financing activities | ||||||
Proceeds from at-the-market equity financing, net of issuance costs | 1,747,468 | - | ||||
Proceeds from private placement offering and pre-funded warrants, net | 4,380,975 | 18,121,945 | ||||
Proceeds from exercise of pre-funded warrants | - | 2,662 | ||||
Issuance of stock dividend | (16,182) | - | ||||
Proceeds from exercise of stock options | 8,528 | 114,169 | ||||
Net cash provided by financing activities | 6,120,789 | 18,238,776 | ||||
Net decrease in cash and cash equivalents and restricted cash | (6,994,650) | (11,409,708) | ||||
Cash and cash equivalents and and restricted cash, beginning of year | 10,586,273 | 21,995,981 | ||||
Cash and cash equivalents and restricted cash, end of year | $ | 3,591,623 | $ | 10,586,273 | ||
Reconciliation of cash and restricted cash, end of period: | ||||||
Cash | $ | 3,591,623 | $ | 10,536,273 | ||
Restricted cash | - | 50,000 | ||||
Total cash and restricted cash | $ | 3,591,623 | $ | 10,586,273 | ||


| Last Trade: | US$3.68 |
| Daily Change: | -0.05 -1.42 |
| Daily Volume: | 11,032 |
| Market Cap: | US$29.310M |
November 18, 2025 October 14, 2025 August 26, 2025 August 13, 2025 August 06, 2025 | |