

Company continues noteworthy quarter-over-quarter revenue growth, setting itself apart in the AI sector with a 268% Compound Annual Growth Rate (CAGR)
Highlights:
COLUMBIA, MD / ACCESSWIRE / November 14, 2023 / Rekor Systems, Inc (NASDAQ:REKR) ("Rekor" or the "Company"), a leader in developing and implementing state-of-the-art roadway intelligence technology using AI and machine learning, today announced its financial results for the nine and three months ended September 30, 2023.
"In the third quarter of 2023, we have maintained our impressive revenue growth trend while simultaneously reducing our losses and cash burn. We achieved record quarterly and nine-month revenues in 2023, all while continuing our efforts to expand our market presence and making further investments in our AI technology. This remarkable progress underscores our success in realizing our strategic vision," commented Eyal Hen, CFO, Rekor.
"Even as we maintain our ongoing investments in technology, the chart below highlights an exceptional Compound Annual Growth Rate ("CAGR") of 268% in our AI and technology-related revenue from 2018 to 2022," Hen added.
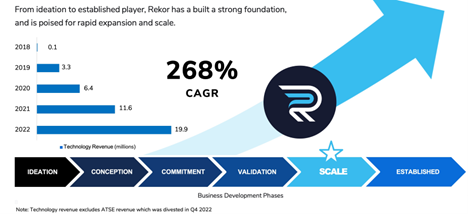
 Rekor Chair and CEO Robert A. Berman emphasized, "Our impressive journey, achieving a 268% CAGR in revenue from 2018 to 2022, underscores our distinctiveness in the AI sector. We've swiftly advanced compared to our industry peers while prudently managing equity and strategically acquiring assets. This progress not only strengthens our position but also generates significant shareholder value. As we persist in technology progress and broaden our market presence, Rekor stands firmly poised for continued success."
Financial Results for the Three and Nine Months Ended September 30, 2023
This section highlights the changes for the three and nine months ended September 30, 2023, compared to the three and nine months ended September 30, 2022. Additionally, this section includes the changes for the three months ending September 30, 2023, compared to those ending June 30, 2023.
Revenues
| Three Months Ended September 30, | Change | Nine Months Ended September 30, | Change | ||||||||||||||||||||||
| (Dollars in thousands) | 2023 | 2022 | $ | % | 2023 | 2022 | $ | % | |||||||||||||||||
Revenue | $ | 9,119 | $ | 6,778 | $ | 2,341 | 35 | % | $ | 23,867 | $ | 13,455 | $ | 10,412 | 77 | % | |||||||||
The increase in revenue for the nine months ended September 30, 2023, compared to the nine months ended September 30, 2022, was primarily attributable to our acquisition of STS in June 2022. During the nine months ended September 30, 2023, revenue attributable to STS was $10,740,000, compared to $3,990,000 for the nine months ended September 30, 2022.
The other main driver of revenue growth during the three and nine months ended September 30, 2023, compared to the three and nine months ended September 30, 2022, was attributable to sales of the Company's software and its contactless compliance program, which both increased in revenue.
| Three Months Ended, | Change | |||||||||||||||
(Dollars in thousands) | September 30, 2023 | June 30, 2023 | $ | % | ||||||||||||
Revenue | $ | 9,119 | $ | 8,563 | $ | 556 | 6 | % | ||||||||
The increase in revenue for the three months ended September 30, 2023, compared to the three months ended June 30, 2022, was primarily due to continued adoption of our suite of solutions.
Loss from Operations Excluding Goodwill Impairment
| Three Months Ended September 30, | Change | Nine Months Ended September 30, | Change | ||||||||||||||||||||||
| (Dollars in thousands) | 2023 | 2022 | $ | % | 2023 | 2022 | $ | % | |||||||||||||||||
Loss from operations | $ | (9,803) | $ | (12,847) | 3,044 | -24 | % | $ | (32,770) | $ | (40,861) | 8,091 | -20 | % | |||||||||||
The decrease in operating loss for the three and nine months ended September 30, 2023, compared to the three and nine months ended September 30, 2022, was primarily attributable to our growth in revenue, highlighted above, accompanied by a significant reduction in expenses.
During the three and nine months ended September 30, 2023, the Company saw a significant decrease in payroll and payroll-related costs as the Company began to focus on operational efficiencies and streamlining its business processes.
| Three Months Ended, | Change | |||||||||||||||
| September 30, 2023 | June 30, 2023 | $ | % | |||||||||||||
(Dollars in thousands) | $ | (9,803) | $ | (10,280) | $ | 477 | -5 | % | ||||||||
Loss from operations | ||||||||||||||||
The primary cause of the decrease in the Company's loss from operations for the three months ended September 30, 2023, compared to the three months ended June 30, 2023, was the Company's increase in revenue accompanied by a continued reduction in personnel costs.
Additional Key Performance Indicators
Performance Obligations
As of September 30, 2023, the Company had approximately $30,203,000 in remaining performance obligations not yet satisfied or partially satisfied. This is an increase of approximately 41%, up from $21,412,000 of remaining performance obligations as of December 31, 2022. Total performance obligations increased over time across all product areas as the Company focused intently on near-term revenue-generating activities and closing long-term contracts.
Total Contract Value
The total contract value of contracts won in a given period provides visibility into the Company's future operating results and cash flows from operations. We make certain assumptions when determining the total contract value of an agreement, such as the success rate of renewal periods, cancellations, and usage estimates.
| Three Months Ended September 30, | Change | Nine Months Ended September 30, | Change | ||||||||||||||||||||||
| 2023 | 2022 | $ | % | 2023 | 2022 | $ | % | ||||||||||||||||||
Total Contract Value | $ | 8,400 | $ | 4,839 | $ | 3,561 | 74 | % | $ | 38,126 | $ | 8,616 | $ | 29,510 | 343 | % | |||||||||
The increase in total contract value is primarily related to large statewide contracts that closed across all three product lines.
Non-GAAP Measures
Adjusted Gross Profit and Adjusted Gross Margin
| Three Months Ended September 30, | Nine Months Ended September 30, | |||||||||||||||
| 2023 | 2022 | 2023 | 2022 | |||||||||||||
| (Dollars in thousands, except percentages) | (Dollars in thousands, except percentages) | |||||||||||||||
Revenue | $ | 9,119 | $ | 6,778 | $ | 23,867 | $ | 13,455 | ||||||||
Cost of revenue, excluding depreciation and amortization | 4,320 | 3,655 | 11,319 | 7,445 | ||||||||||||
Adjusted Gross Profit | $ | 4,799 | $ | 3,123 | $ | 12,548 | $ | 6,010 | ||||||||
Adjusted Gross Margin | 52.6 | % | 46.1 | % | 52.6 | % | 44.7 | % | ||||||||
Adjusted Gross Margin for the three and nine months ended September 30, 2023, increased compared to the three and nine months ended September 30, 2022. As the Company continues to scale and standardize its product offerings, it has realized operational efficiencies that have resulted in an improved Adjusted Gross Margin. Additionally, during the three and nine months ended September 30, 2023, the Company had a higher mix of software sales, which typically carry a higher Adjusted Gross Margin.
EBITDA and Adjusted EBITDA
The Company calculates EBITDA as net loss before interest, taxes, depreciation, and amortization. The Company calculates Adjusted EBITDA as net loss before interest, taxes, depreciation, and amortization, adjusted for (i) impairment of intangible assets, (ii) loss on extinguishment of debt, (iii) stock-based compensation, (iv) losses or gains on sales of subsidiaries, and (v) other unusual or non-recurring items. EBITDA and Adjusted EBITDA are not measurements of financial performance or liquidity under accounting principles generally accepted in the U.S. ("U.S. GAAP") and should not be considered as an alternative to net earnings or cash flow from operating activities as indicators of our operating performance or as a measure of liquidity or any other measures of performance derived in accordance with U.S. GAAP. EBITDA and Adjusted EBITDA are presented because we believe they are frequently used by securities analysts, investors, and other interested parties in the evaluation of a company's ability to service and/or incur debt. However, other companies in our industry may calculate EBITDA and Adjusted EBITDA differently than we do.
The following table sets forth the components of the EBITDA and Adjusted EBITDA for the periods included (dollars in thousands):
| Three Months Ended September 30, | Nine Months Ended September 30, | |||||||||||||||
| 2023 | 2022 | 2023 | 2022 | |||||||||||||
Net loss from continuing operations | $ | (10,566) | $ | (48,128) | $ | (34,361) | $ | (76,191) | ||||||||
Income taxes | - | (954) | - | (954) | ||||||||||||
Interest | 906 | 21 | 2,576 | 46 | ||||||||||||
Depreciation and amortization | 1,963 | 1,852 | 5,925 | 4,477 | ||||||||||||
EBITDA | $ | (7,697) | $ | (47,209) | $ | (25,860) | $ | (72,622) | ||||||||
Share-based compensation | $ | 1,081 | $ | 1,628 | $ | 3,237 | $ | 5,413 | ||||||||
Goodwill impairment | - | 34,835 | - | 34,835 | ||||||||||||
Gain on extinguishment of debt | - | - | (527) | - | ||||||||||||
Adjusted EBITDA | $ | (6,616) | $ | (10,746) | $ | (23,150) | $ | (32,374) | ||||||||
Rekor has scheduled a conference call to discuss the third quarter of 2023 results on Tuesday, November 14, 2023, at 4:30 P.M. (Eastern).
Any person interested in participating in the call should please dial in approximately 10 minutes prior to the start of the call using the following information:
North America: 877-407-8037 (Toll Free)
International: 201-689-8037
A live webcast of the conference call will be available online at: https://link.edgepilot.com/s/19b0cf3e/53lu971YhECd5Oy84sCC4w?u=https://event.choruscall.com/mediaframe/webcast.html?webcastid=6kxGEKzK
REPLAY INFORMATION
A replay will be made available online approximately two hours following the live call for a period of two weeks. To access the replay, use the following numbers:
Replay Dial-In: 877-660-6853 / 201-612-7415
Access ID: 13742182
An archived webcast will also be available to replay this conference call directly from the Company's website under Investors, Events & Presentations.
About Rekor Systems, Inc.
Rekor Systems, Inc. (NASDAQ:REKR) is a leader in developing and implementing state-of-the-art roadway intelligence systems using AI and machine learning. Pioneering the implementation of digital infrastructure in our communities, Rekor is redefining infrastructure by collecting, connecting, and organizing the world's mobility data - laying the foundation for a digital-enabled operating system for the road. With our Rekor One® Roadway Intelligence Engine at the foundation of our technology, we aggregate and transform trillions of data points into intelligence through proprietary computer vision, machine learning, and big data analytics that power our platforms and applications. Our solutions provide actionable insights that give governments and businesses a comprehensive picture of roadways while providing a collaborative environment that drives the world to be safer, greener, and more efficient.
To learn more please visit our website: https://rekor.ai, and follow Rekor on social media on LinkedIn, Twitter, and Facebook.
Forward-Looking Statements
This press release and its links and attachments contain statements concerning Rekor Systems, Inc. and its future expectations, plans, and prospects that constitute "forward-looking statements" within the meaning of Section 27A of the Securities Act of 1933, as amended, and Section 21E of the Securities Exchange Act of 1934, as amended, including statements regarding the impact of Rekor's core suite of AI-powered technology and the size and shape of the global market for ALPR systems. Such forward-looking statements are made pursuant to the safe harbor provisions of the Private Securities Litigation Reform Act of 1995. For this purpose, any statements that are not statements of historical fact may be deemed to be forward-looking statements. In some cases, you can identify forward-looking statements by terms such as "may," "should," "expects," "plans," "anticipates," "could," "intends," "target," "projects," "contemplates," "believes," "estimates," "predicts," "potential," or "continue," by the negative of these terms or by other similar expressions. You are cautioned that such statements are subject to many risks and uncertainties that could cause future circumstances, events, or results to differ materially from those projected in the forward-looking statements, including the risks that actual circumstances, events or results may differ materially from those projected in the forward-looking statements, particularly as a result of various risks and other factors identified in our filings with the Securities and Exchange Commission. All forward-looking statements contained in this press release speak only as of the date on which they were made and are based on management's assumptions and estimates as of such date. We do not undertake any obligation to publicly update any forward-looking statements, whether as a result of the receipt of new information, the occurrence of future events, or otherwise.
Company Contact:
Rekor Systems, Inc.
Eyal Hen
Chief Financial Officer
Phone: +1 (443) 545-7260
This email address is being protected from spambots. You need JavaScript enabled to view it.
Media & Investor Relations Contact:
Rekor Systems, Inc.
Charles Degliomini
This email address is being protected from spambots. You need JavaScript enabled to view it.
REKOR SYSTEMS, INC.
CONSOLIDATED BALANCE SHEETS
(Dollars in thousands, except share data)
| September 30, 2023 | December 31, 2022 | |||||||
ASSETS | ||||||||
Current assets | ||||||||
Cash and cash equivalents | $ | 7,034 | $ | 1,924 | ||||
Restricted cash and cash equivalents | 325 | 254 | ||||||
Accounts receivable, net | 7,024 | 3,238 | ||||||
Inventory | 3,459 | 1,986 | ||||||
Note receivable, current portion | 340 | 340 | ||||||
Other current assets, net | 1,674 | 1,202 | ||||||
Current assets of discontinued operations | - | 331 | ||||||
Total current assets | 19,856 | 9,275 | ||||||
Long-term assets | ||||||||
Property and equipment, net | 14,077 | 16,733 | ||||||
Right-of-use operating lease assets, net | 9,516 | 9,662 | ||||||
Right-of-use financing lease assets, net | 1,994 | - | ||||||
Goodwill | 20,593 | 20,593 | ||||||
Intangible assets, net | 18,208 | 21,299 | ||||||
Note receivable, long-term | 567 | 822 | ||||||
SAFE investment | - | 2,005 | ||||||
Deposits | 3,348 | 3,451 | ||||||
Total long-term assets | 68,303 | 74,565 | ||||||
Total assets | $ | 88,159 | $ | 83,840 | ||||
| LIABILITIES AND SHAREHOLDERS' EQUITY | ||||||||
Current liabilities | ||||||||
Accounts payable and accrued expenses | $ | 5,619 | $ | 5,963 | ||||
Notes payable, current portion | 1,000 | 1,000 | ||||||
Related party notes, current portion | - | 1,000 | ||||||
Loan payable, current portion | 83 | 106 | ||||||
Lease liability operating, short-term | 1,143 | 1,069 | ||||||
Lease liability financing, short-term | 502 | - | ||||||
Contract liabilities, short-term | 4,503 | 3,044 | ||||||
Other current liabilities | 3,427 | 2,772 | ||||||
Current liabilities of discontinued operations | - | 490 | ||||||
Total current liabilities | 16,277 | 15,444 | ||||||
Long-term Liabilities | ||||||||
Notes payable, long-term | 1,000 | 2,000 | ||||||
2023 Promissory Notes, net of debt discount of $1,177 | 2,823 | - | ||||||
2023 Promissory Notes - related party, net of debt discount of $2,500 | 6,000 | - | ||||||
Loan payable, long-term | 292 | 349 | ||||||
Lease liability operating, long-term | 13,395 | 14,237 | ||||||
Lease liability financing, long-term | 1,082 | - | ||||||
Contract liabilities, long-term | 1,517 | 1,005 | ||||||
Deferred tax liability | 52 | 52 | ||||||
Other non-current liabilities | 2,142 | 1,416 | ||||||
Total long-term liabilities | 28,303 | 19,059 | ||||||
Total liabilities | 44,580 | 34,503 | ||||||
Commitments and contingencies (Note 9) | ||||||||
Stockholders' equity | ||||||||
Common stock, $0.0001 par value; authorized; 100,000,000 shares; issued: 69,233,969, shares as of September 30, 2023 and 54,446,602 as of December 31, 2022; outstanding: 69,137,461 shares as of September 30, 2023 and 54,405,080 as of December 31, 2022. | 7 | 5 | ||||||
Preferred stock, $0.0001 par value, 2,000,000 authorized, 505,000 shares designated as Series A and 240,861 shares designated as Series B as of September 30, 2023 and December 31, 2022, respectively. No preferred stock was issued or outstanding as of September 30, 2023 or December 31, 2022, respectively. | - | - | ||||||
Treasury stock, 96,508 and 41,522 shares as of September 30, 2023 and December 31, 2022, respectively. | (522) | (417) | ||||||
Additional paid-in capital | 231,453 | 202,747 | ||||||
Accumulated deficit | (187,359) | (152,998) | ||||||
Total stockholders' equity | 43,579 | 49,337 | ||||||
Total liabilities and stockholders' equity | $ | 88,159 | $ | 83,840 | ||||
REKOR SYSTEMS, INC.
CONSOLIDATED STATEMENTS OF OPERATIONS
(Dollars in thousands, except share data)
| Three Months Ended September 30, | Nine Months Ended September 30, | |||||||||||||||
| 2023 | 2022 | 2023 | 2022 | |||||||||||||
Revenue | $ | 9,119 | $ | 6,778 | $ | 23,867 | $ | 13,455 | ||||||||
Cost of revenue, excluding depreciation and amortization | 4,320 | 3,655 | 11,319 | 7,445 | ||||||||||||
Operating expenses: | ||||||||||||||||
General and administrative expenses | 6,871 | 6,775 | 19,941 | 22,232 | ||||||||||||
Selling and marketing expenses | 1,498 | 2,432 | 5,441 | 6,390 | ||||||||||||
Research and development expenses | 4,270 | 4,911 | 14,011 | 13,772 | ||||||||||||
Depreciation and amortization | 1,963 | 1,852 | 5,925 | 4,477 | ||||||||||||
Goodwill impairment | - | 34,835 | - | 34,835 | ||||||||||||
Total operating expenses | 14,602 | 50,805 | 45,318 | 81,706 | ||||||||||||
Loss from operations | (9,803) | (47,682) | (32,770) | (75,696) | ||||||||||||
Other income (expense): | ||||||||||||||||
Gain on extinguishment of debt | - | - | 527 | - | ||||||||||||
Interest expense, net | (906) | (21) | (2,576) | (46) | ||||||||||||
Other income (expense) | 143 | (1,379) | 458 | (1,403) | ||||||||||||
Total other income (expense) | (763) | (1,400) | (1,591) | (1,449) | ||||||||||||
Loss before income taxes | (10,566) | (49,082) | (34,361) | (77,145) | ||||||||||||
Income tax benefit | - | 954 | - | 954 | ||||||||||||
Net loss from continuing operations | (10,566) | (48,128) | (34,361) | (76,191) | ||||||||||||
Net income from discontinued operations | - | 94 | - | 289 | ||||||||||||
Net loss | $ | (10,566) | $ | (48,034) | $ | (34,361) | $ | (75,902) | ||||||||
Loss per common share from continuing operations - basic and diluted | $ | (0.16) | $ | (0.90) | $ | (0.56) | $ | (1.58) | ||||||||
Earning per common share discontinued operations - basic and diluted | - | 0.00 | - | 0.01 | ||||||||||||
Loss per common share - basic and diluted | $ | (0.16) | $ | (0.90) | $ | (0.56) | $ | (1.57) | ||||||||
Weighted average shares outstanding | ||||||||||||||||
Basic and diluted | 66,671,622 | 53,482,110 | 61,125,035 | 48,279,713 | ||||||||||||


| Last Trade: | US$1.59 |
| Daily Change: | 0.04 2.58 |
| Daily Volume: | 15,979,833 |
| Market Cap: | US$201.440M |
December 16, 2025 November 19, 2025 November 13, 2025 October 14, 2025 | |