

Company recorded $7.4 million in quarterly revenues and delivers fourth consecutive quarter of positive Adjusted EBITDA while continuing to rapidly scale production capacity at the Valleyfield Facility
Completed first harvest from the Valleyfield Facility with positive market feedback consistent with the quality of products Cannara is known for
All financial results are reported in Canadian dollars, unless otherwise stated.
Cannara Biotech Inc. ("Cannara" or the "Company") (TSXV: LOVE) (OTCQB: LOVFF) (FRA: 8CB), a vertically integrated producer of premium-grade cannabis and derivative products with two mega facilities based in Québec spanning over 1,650,000 sq. ft., today announced its fiscal second quarter 2022 financial and operating results for the three and six-month periods ended February 28, 2022.
Fiscal Second Quarter 2022 Financial and Operational Highlights
Highlights Subsequent to Quarter End
"We are proud of the advances we made in the second quarter. We planted three 25,000 square foot growing zones and successfully harvested our first zone in February," commented Zohar Krivorot, President & Chief Executive Officer of Cannara. "By redesigning the Valleyfield Facility and receiving consistent positive consumer feedback on our first harvest, we have successfully confirmed our ability to grow premium cannabis at scale. Our objective for the year is to turn on six growing zones by August 2022 at Valleyfield and we remain on schedule to do so".
Nicholas Sosiak, Chief Financial Officer of Cannara commented, "While we are focused on investing into our own assets, we continue to outperform from a financial standpoint. This was our fourth consecutive quarter of positive Adjusted EBITDA while continuing to support and significantly grow our production footprint. We added over 40 new employees to help support the growth at the Valleyfield Facility yet the revenues from this Facility will only start to be realized in the third quarter of 2022. We are working extremely hard this quarter and next to expand our distribution channels and get products listed in new markets. I am looking forward to the coming quarters as we harvest and sell our products from the new operating zones at our Valleyfield Facility and expand our footprint into new markets across Canada."
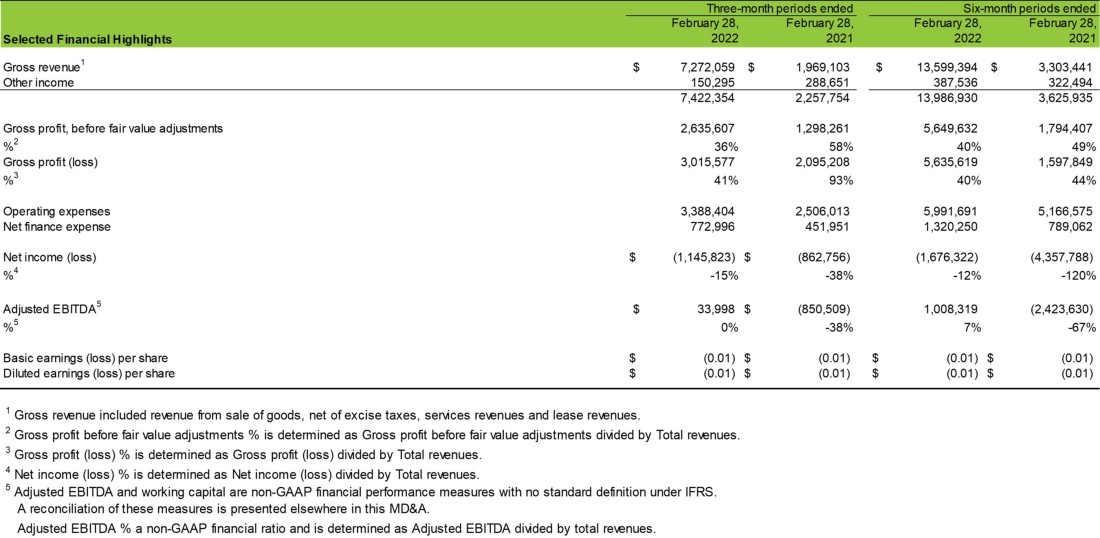
Three-month periods ended | Six-month periods ended | ||||
Selected Financial Highlights | February 28, | February 28, | February 28, | February 28, | |
Gross revenue1 | $ 7,272,059 | $ 1,969,103 | $ 13,599,394 | $ 3,303,441 | |
Other income | 150,295 | 288,651 | 387,536 | 322,494 | |
7,422,354 | 2,257,754 | 13,986,930 | 3,625,935 | ||
Gross profit, before fair value adjustments | 2,635,607 | 1,298,261 | 5,649,632 | 1,794,407 | |
%2 | 36% | 58% | 40% | 49% | |
Gross profit (loss) | 3,015,577 | 2,095,208 | 5,635,619 | 1,597,849 | |
%3 | 41% | 93% | 40% | 44% | |
Operating expenses | 3,388,404 | 2,506,013 | 5,991,691 | 5,166,575 | |
Net finance expense | 772,996 | 451,951 | 1,320,250 | 789,062 | |
Net income (loss) | $ (1,145,823) | $ (862,756) | (1,676,322) | (4,357,788) | |
%4 | -15% | -38% | -12% | -120% | |
Adjusted EBITDA5 | $ 33,998 | $ (850,509) | 1,008,319 | (2,423,630) | |
%5 | 0% | -38% | 7% | -67% | |
Basic earnings (loss) per share | $ (0.01) | $ (0.01) | $ (0.01) | $ (0.01) | |
Diluted earnings (loss) per share | $ (0.01) | $ (0.01) | $ (0.01) | $ (0.01) | |
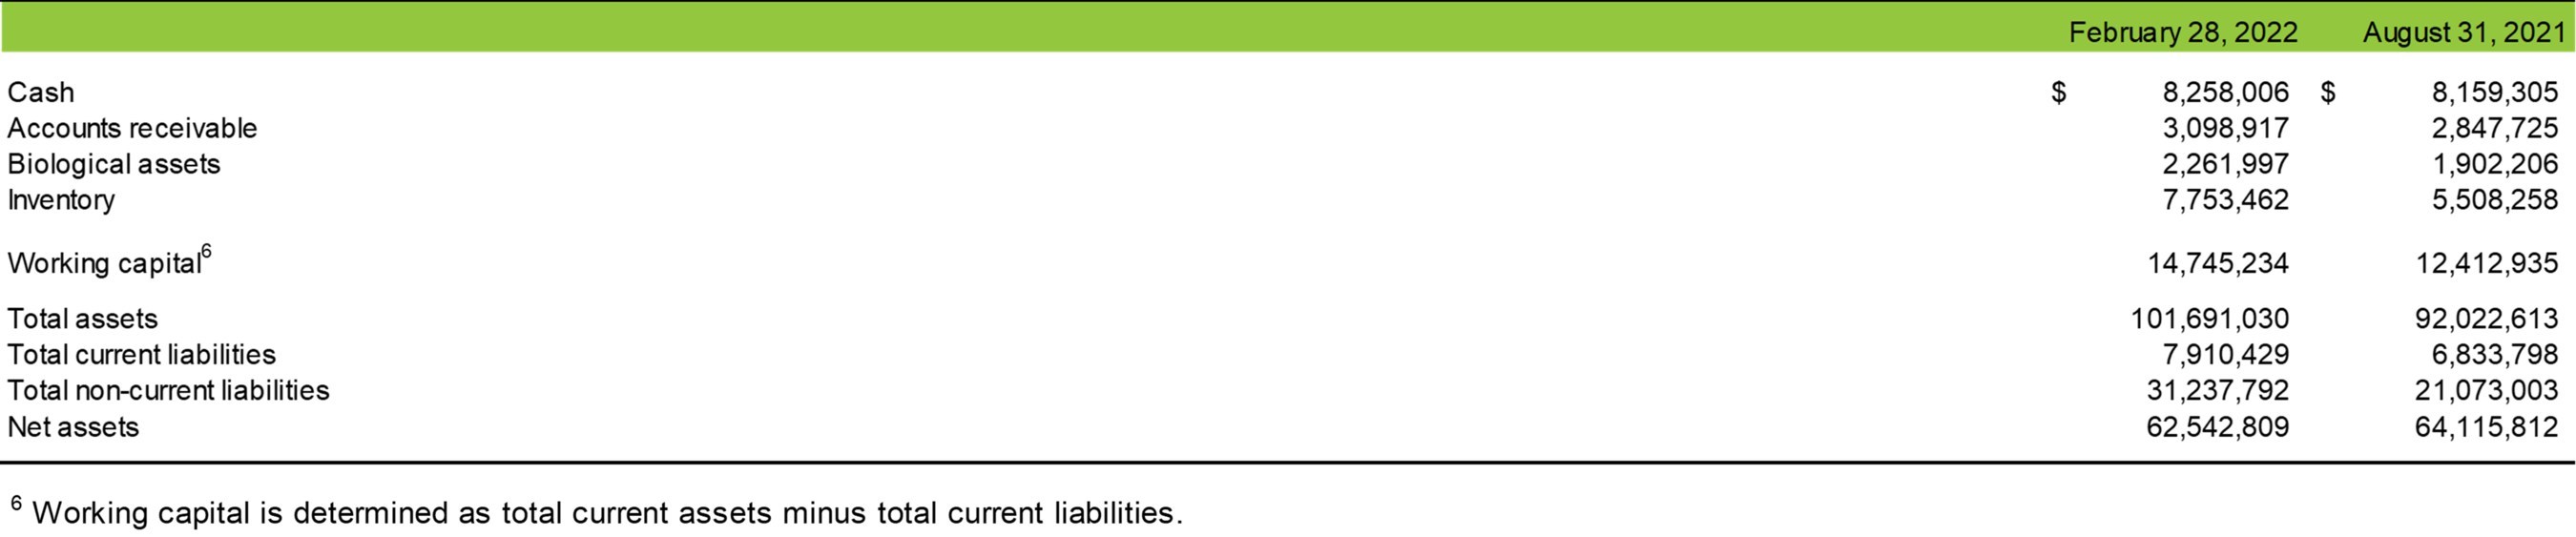
February 28, 2022 | August 31, 2021 | ||||
Cash | $ 8,258,006 | $ 8,159,305 | |||
Accounts receivable | 3,098,917 | 2,847,725 | |||
Biological assets | 2,261,997 | 1,902,206 | |||
Inventory | 7,753,462 | 5,508,258 | |||
Working capital6 | 14,745,234 | 12,412,935 | |||
Total assets | 101,691,030 | 92,022,613 | |||
Total current liabilities | 7,910,429 | 6,833,798 | |||
Total non-current liabilities | 31,237,792 | 21,073,003 | |||
Net assets | 62,542,809 | 64,115,812 | |||
1 Gross revenue included revenue from sale of goods, net of excise taxes, services revenues and lease revenues. | |||||
2 Gross profit before fair value adjustments % is determined as Gross profit before fair value adjustments divided by Total revenues. | |||||
3 Gross profit (loss) % is determined as Gross profit (loss) divided by Total revenues. | |||||
4 Net income (loss) % is determined as Net income (loss) divided by Total revenues. | |||||
5 Adjusted EBITDA and working capital are non-GAAP financial performance measures with no standard definition under IFRS. | |||||
Adjusted EBITDA % a non-GAAP financial ratio and is determined as Adjusted EBITDA divided by total revenues. | |||||
6 Working capital is determined as total current assets minus total current liabilities. | |||||
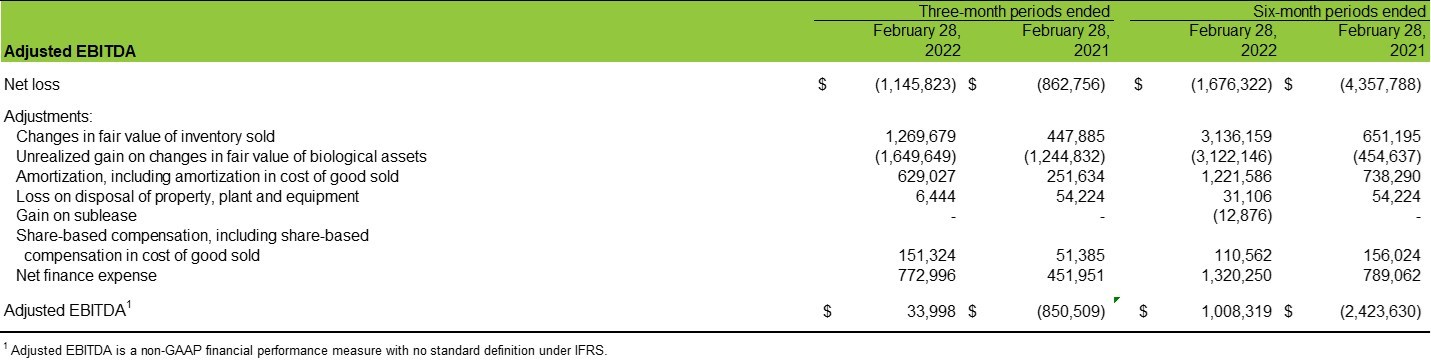
Three-month periods ended | Six-month periods ended | ||||
Adjusted EBITDA | February 28, | February 28, | February 28, | February 28, | |
Net loss | $ (1,145,823) | $ (862,756) | $ (1,676,322) | $ (4,357,788) | |
Adjustments: | |||||
Changes in fair value of inventory sold | 1,269,679 | 447,885 | 3,136,159 | 651,195 | |
Unrealized gain on changes in fair value of biological assets | (1,649,649) | (1,244,832) | (3,122,146) | (454,637) | |
Amortization, including amortization in cost of good sold | 629,027 | 251,634 | 1,221,586 | 738,290 | |
Loss on disposal of property, plant and equipment | 6,444 | 54,224 | 31,106 | 54,224 | |
Gain on sublease | - | - | (12,876) | - | |
Share-based compensation, including share-based | 151,324 | 51,385 | 110,562 | 156,024 | |
Net finance expense | 772,996 | 451,951 | 1,320,250 | 789,062 | |
Adjusted EBITDA1 | $ 33,998 | $ (850,509) | $ 1,008,319 | $ (2,423,630) | |
1 Adjusted EBITDA is a non-GAAP financial performance measure with no standard definition under IFRS. | |||||
Outstanding Shares
As at the date of this report, the Company had 876,981,321 common shares and 40,645,781 stock options issued and outstanding. For further information, the complete Condensed Interim Consolidated Financial Statements and Management's Discussion and Analysis for the three and six-month periods ended February 28, 2022 and 2021, along with additional information about the Company and all of its public filings are available at sedar.com and the Company's investor website, investors.cannara.ca.
About Cannara Biotech Inc.
Cannara Biotech Inc. (TSXV: LOVE) (OTCQB: LOVFF) (FRA: 8CB) is a vertically integrated producer of premium-grade cannabis and cannabis-derivative products for the Québec and Canadian markets. Cannara owns two mega facilities based in Québec spanning over 1,650,000 sq. ft., providing the Company with 125,000kg of potential annualized cultivation output. Leveraging Québec's low electricity costs, Cannara's facilities produce premium-grade cannabis products at an affordable price. For more information, please visit cannara.ca.
Neither the TSX Venture Exchange nor its Regulation Services Provider (as that term is defined in policies of the TSX Venture Exchange) accepts responsibility for the adequacy or accuracy of this release.
Cautionary Statement Regarding "Forward-Looking" Information
This information release contains certain forward-looking information. Such information involves known and unknown risks, uncertainties and other factors that may cause actual results, performance or achievements to be materially different from those implied by statements herein, and therefore these statements should not be read as guarantees of future performance or results. All forward-looking statements are based on the Company's current beliefs as well as assumptions made by and information currently available to it as well as other factors. Readers are cautioned not to place undue reliance on these forward-looking statements, which speak only as of the date of this press release. Due to risks and uncertainties, including the risks and uncertainties identified by the Company in its public securities filings, actual events may differ materially from current expectations. The Company disclaims any intention or obligation to update or revise any forward-looking statements, whether as a result of new information, future events or otherwise.


| Last Trade: | US$1.18 |
| Daily Volume: | 0 |
| Market Cap: | US$111.980M |
July 28, 2025 July 24, 2025 January 27, 2025 | |