

TORONTO, ON / ACCESSWIRE / November 29 , 2023 / Nextech3D.AI (OTCQX:NEXCF)(CSE:NTAR)(FSE:EP2), a Generative AI-Powered 3D model supplier for Amazon, P&G, Kohls and other major e-commerce retailers is pleased to report its financial and operating results for its third quarter ended September 30, 2023.
Please join Evan Gappelberg, Chief Executive Officer and Andrew Chan, Chief Financial Officer after the close today November 29, 2023 at 5:00 P.M. ET where Nextech3D.ai will host a conference call to discuss these financial results.
Evan Gappelberg - CEO Commentary
"We continue to build towards our future with solid year over year growth of +97% across our business. While I'm personally disappointed that we didn't see Amazon open seller central in Q3 and consequently our revenue spike, I'm also confident that it is in motion and likely to happen in Q1, 2024." He continued, "In the fast-evolving world of technology, adaptability is key to sustained success. Our investment in our AI library of 3D meshes or parts is setting us up for success in 2024. We are on the cusp of a significant breakthrough that promises to have a materially positive impact on our business in 2024 and beyond. As AI and 3D models continue to shape the future for e-commerce, we have positioned ourselves at the forefront of this transformative wave. We are ready to see results and capitalize on our AI capabilities in a pivotal way starting in Q1 2024."
Highlights - 9 Months Ending Ending September 30, 2023:
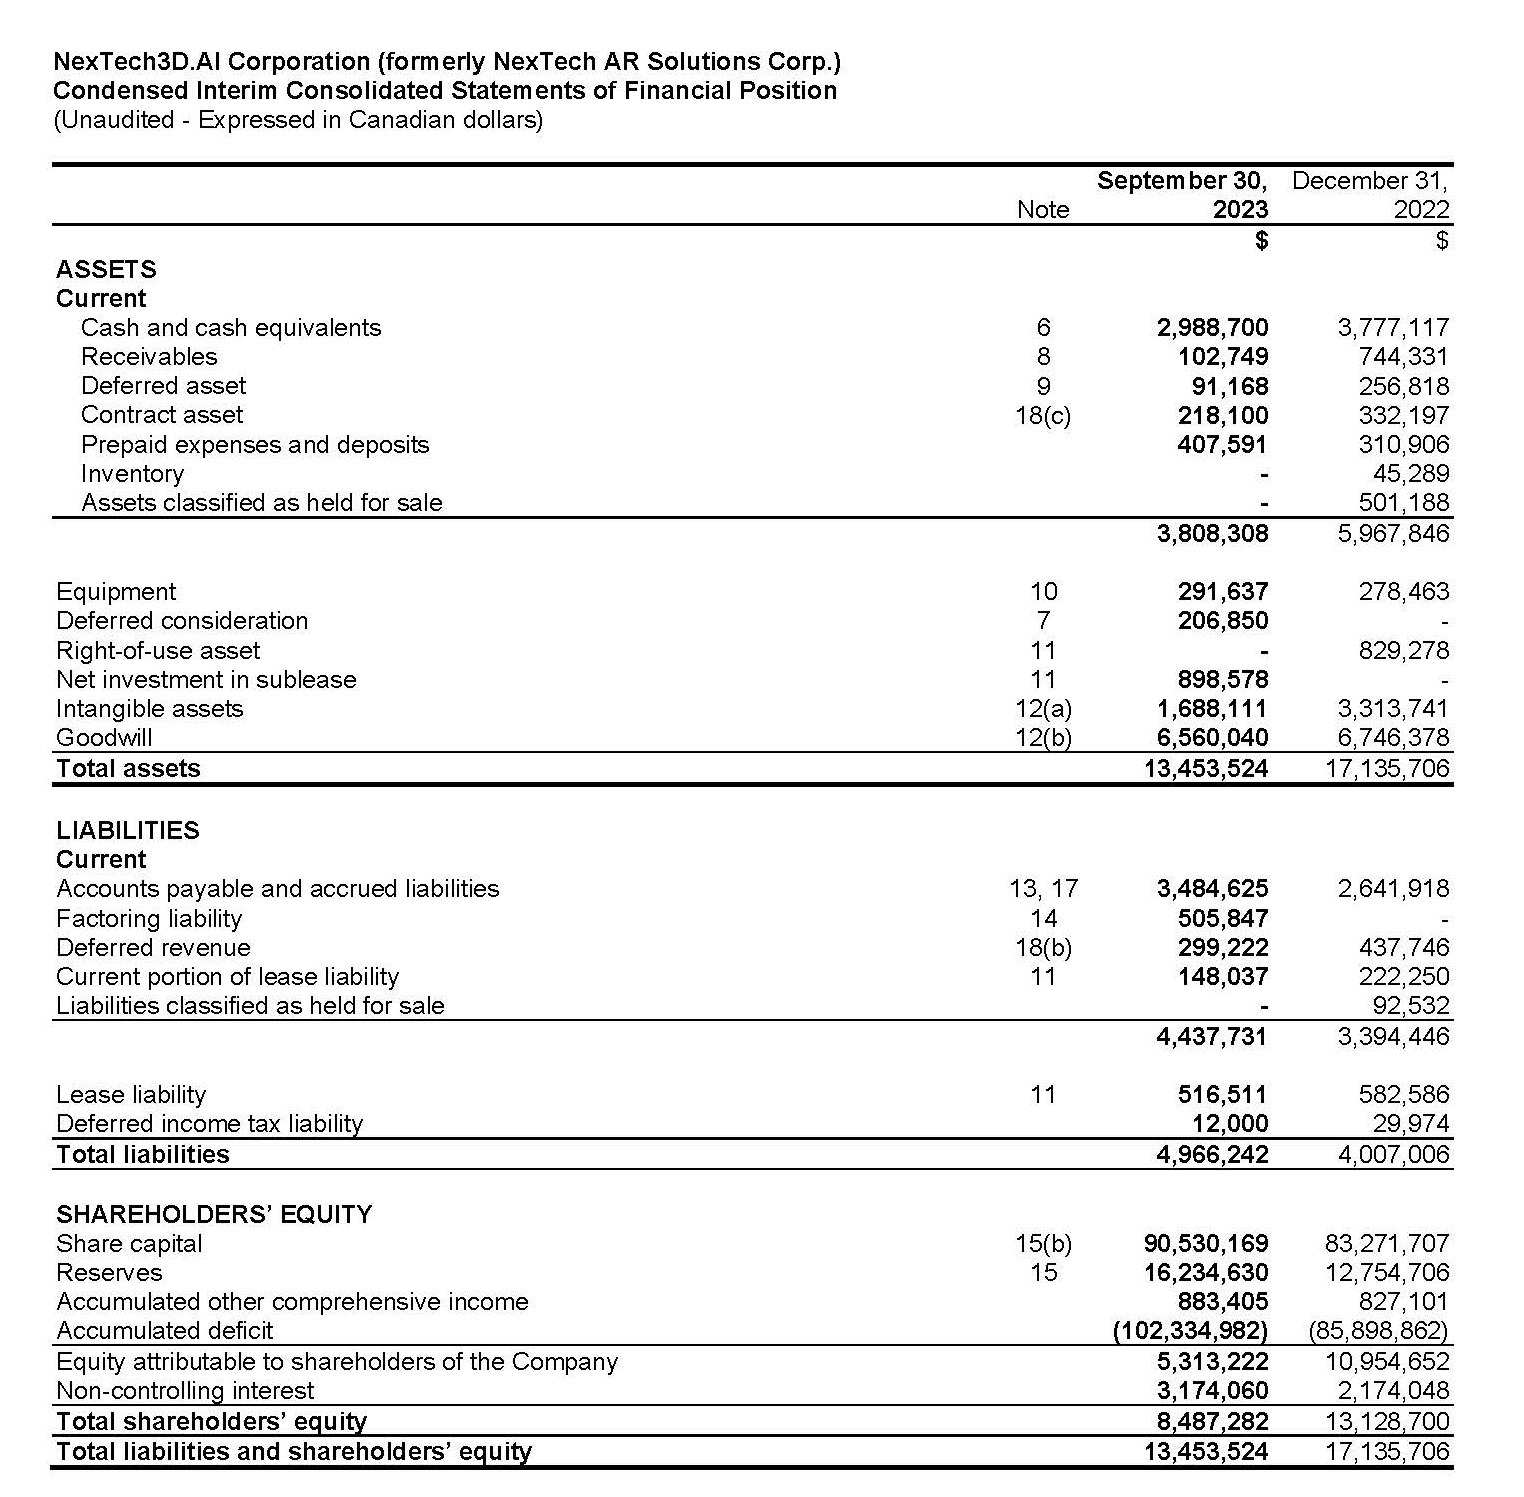
Condensed Consolidated Interim Statements of Financial Position
| 30-Sep-23 | 31-Dec-22 | |||||||
ASSETS | ||||||||
Current | ||||||||
Cash & cash equivalents | 2,988,700 | 3,777,117 | ||||||
Receivables | 102,749 | 744,331 | ||||||
Deferred asset | 91,168 | 256,818 | ||||||
Contract asset | 218,100 | 332,197 | ||||||
Prepaid expenses | 407,591 | 310,906 | ||||||
Inventory | - | 45,289 | ||||||
Non current assets held for sale | - | 501,188 | ||||||
Total current assets | 3,808,308 | 5,967,846 | ||||||
Equipment | 291,637 | 278,463 | ||||||
Deferred consideration | 206,850 | - | ||||||
Right of use asset | - | 829,278 | ||||||
Finance lease receivable on sublease | 898,578 | - | ||||||
Intangible assets | 1,688,111 | 3,313,741 | ||||||
Goodwill | 6,560,040 | 6,746,378 | ||||||
Total assets | 13,453,524 | 17,135,706 | ||||||
LIABILITIES | ||||||||
Current | ||||||||
Accounts payable and accrued liabilities | 3,484,625 | 2,641,918 | ||||||
Factoring liability | 505,847 | - | ||||||
Deferred revenue | 299,222 | 437,746 | ||||||
Lease liability | 148,037 | 222,250 | ||||||
Liabilities associated with assets held for sale | - | 92,532 | ||||||
Total current liabilities | 4,437,731 | 3,394,446 | ||||||
Lease liability - non current | 516,511 | 582,586 | ||||||
Deferred tax liabilities | 12,000 | 29,974 | ||||||
Total liabilities | 4,966,242 | 4,007,006 | ||||||
Shareholders' Equity | ||||||||
Share capital | 90,530,169 | 83,271,707 | ||||||
Reserves | 16,234,630 | 12,754,706 | ||||||
Accumulated Other Comprehensive Income | 883,405 | 827,101 | ||||||
Shareholder's equity attributable to Nextech shareholders | (102,334,982 | ) | (85,898,862 | ) | ||||
Total common shareholders' equity | 5,313,222 | 10,954,652 | ||||||
Non controlling interest | 3,174,060 | 2,174,048 | ||||||
Total equity | 8,487,282 | 13,128,700 | ||||||
Total liabilities and shareholders' equity | 13,453,524 | 17,135,706 | ||||||
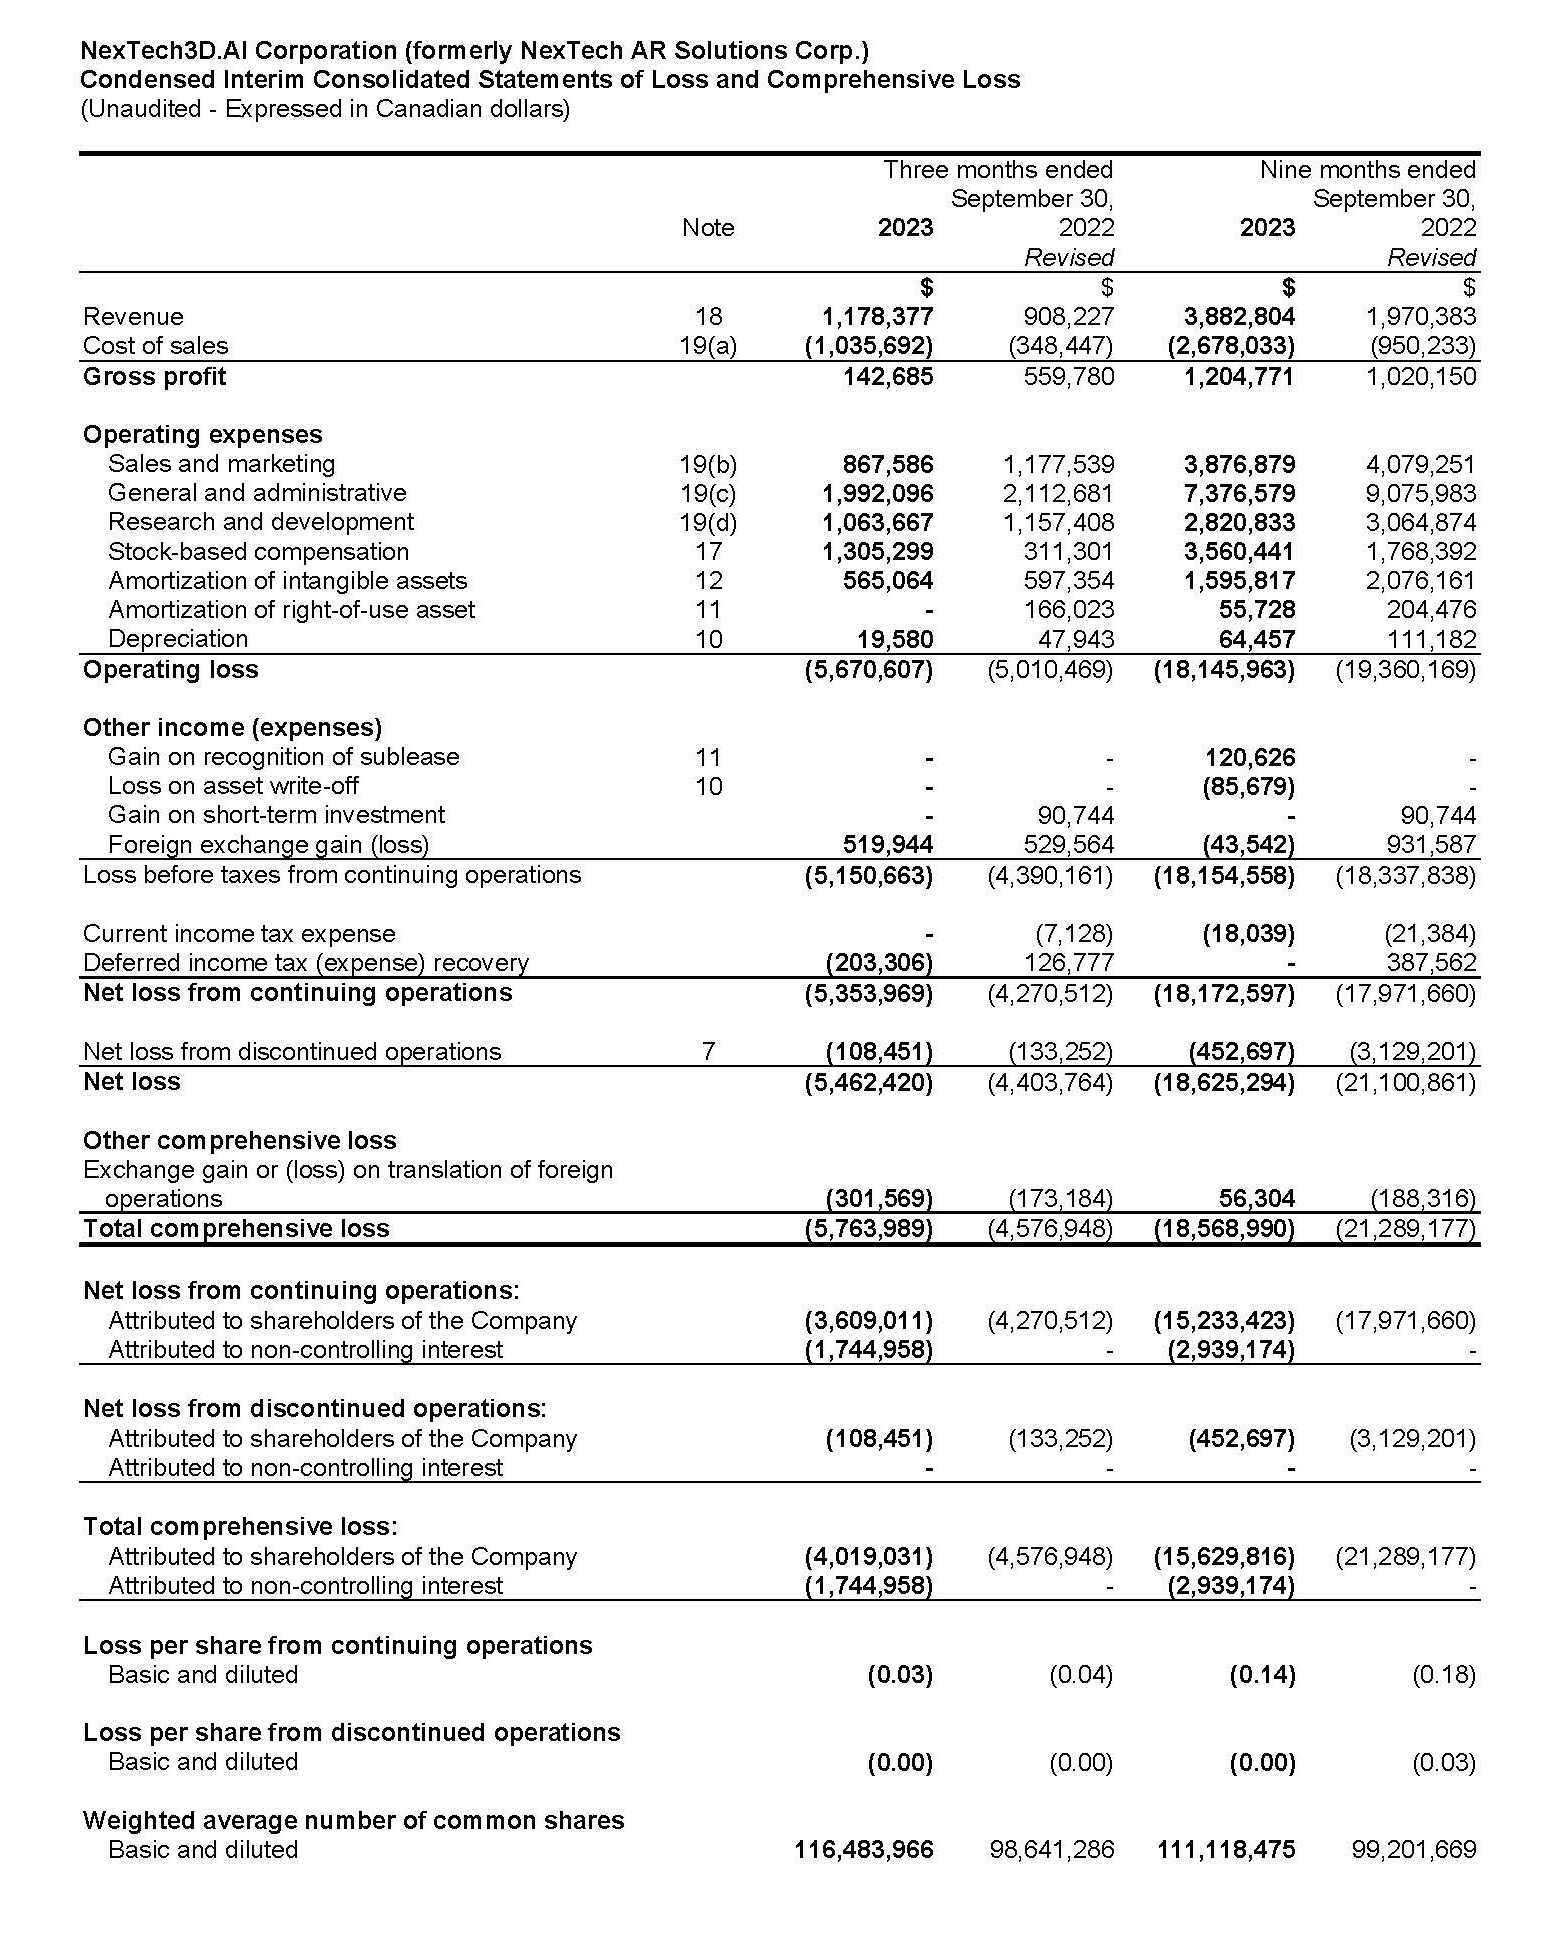
Condensed Consolidated Interim Statements of Comprehensive Loss
| QTD | YTD | |||||||||||||||
| 30-Sep-23 | 30-Sep-22 | 30-Sep-23 | 30-Sep-22 | |||||||||||||
| $ | $ | $ | $ | |||||||||||||
Revenue | 1,178,377 | 908,227 | 3,882,804 | 1,970,383 | ||||||||||||
Cost of sales | (1,035,692 | ) | (348,447 | ) | (2,678,033 | ) | (950,233 | ) | ||||||||
Gross profit | 142,685 | 559,780 | 1,204,771 | 1,020,150 | ||||||||||||
Operating expenses: | ||||||||||||||||
Sales and marketing | 867,586 | 1,177,539 | 3,876,879 | 4,079,251 | ||||||||||||
General and administrative | 1,992,096 | 2,112,681 | 7,376,579 | 9,075,983 | ||||||||||||
Research and development | 1,063,667 | 1,157,408 | 2,820,833 | 3,064,874 | ||||||||||||
Stock based compensation | 1,305,299 | 311,301 | 3,560,441 | 1,768,392 | ||||||||||||
Amortization | 565,064 | 597,354 | 1,595,817 | 2,076,161 | ||||||||||||
Right of use amortization | - | 166,023 | 55,728 | 204,476 | ||||||||||||
Depreciation | 19,580 | 47,943 | 64,457 | 111,182 | ||||||||||||
Operating profit (loss) | (5,670,607 | ) | (5,010,469 | ) | (18,145,963 | ) | (19,360,169 | ) | ||||||||
Other income (expense): | ||||||||||||||||
Gain on sublease recognition | - | - | 120,626 | - | ||||||||||||
Loss on asset disposal | - | - | (85,679 | ) | - | |||||||||||
Loss (gain) on short-term investments | - | 90,744 | - | 90,744 | ||||||||||||
Foreign exchange gain (loss) | 519,944 | 529,564 | (43,542 | ) | 931,587 | |||||||||||
Profit (Loss) before income taxes | (5,150,663 | ) | (4,390,161 | ) | (18,154,558 | ) | (18,337,838 | ) | ||||||||
Current income tax expense | - | (7,128 | ) | (18,039 | ) | (21,384 | ) | |||||||||
Deferred income tax recovery | (203,306 | ) | 126,777 | - | 387,562 | |||||||||||
Net income (loss) from continuing operations | (5,353,969 | ) | (4,270,512 | ) | (18,172,597 | ) | (17,971,660 | ) | ||||||||
Income (loss) from discontinued operations | (108,451 | ) | (133,252 | ) | (452,697 | ) | (3,129,201 | ) | ||||||||
Net loss | (5,462,420 | ) | (4,403,764 | ) | (18,625,294 | ) | (21,100,861 | ) | ||||||||
Other comprehensive income (loss) | ||||||||||||||||
Exchange differences on translating foreign operations, continuing operations | (301,569 | ) | (173,184 | ) | 56,304 | (188,316 | ) | |||||||||
Comprehensive income (loss) | (5,763,989 | ) | (4,576,948 | ) | (18,568,990 | ) | (21,289,177 | ) | ||||||||
Net loss from C/O attributed to: | ||||||||||||||||
Parent | (3,609,011 | ) | (4,270,512 | ) | (15,233,423 | ) | (17,971,660 | ) | ||||||||
Non controlling interest - PL | (1,744,958 | ) | - | (2,939,174 | ) | - | ||||||||||
Net loss from D/O attributed to: | ||||||||||||||||
Parent | (108,451 | ) | (133,252 | ) | (452,697 | ) | (3,129,201 | ) | ||||||||
Non controlling interest - PL | - | - | - | - | ||||||||||||
Comprehensive loss attributed to: | ||||||||||||||||
Parent | (4,019,031 | ) | (4,576,948 | ) | (15,629,816 | ) | (21,289,177 | ) | ||||||||
Non controlling interest | (1,744,958 | ) | - | (2,939,174 | ) | - | ||||||||||
Loss per share from C/O - basic and diluted | (0.03 | ) | (0.04 | ) | (0.14 | ) | (0.18 | ) | ||||||||
Loss per share from D/O - basic and diluted | (0.00 | ) | (0.00 | ) | (0.00 | ) | (0.03 | ) | ||||||||
Weighted average number of common shares outstanding | ||||||||||||||||
Basic and diluted | 116,483,966 | 98,641,286 | 111,118,475 | 99,201,669 | ||||||||||||
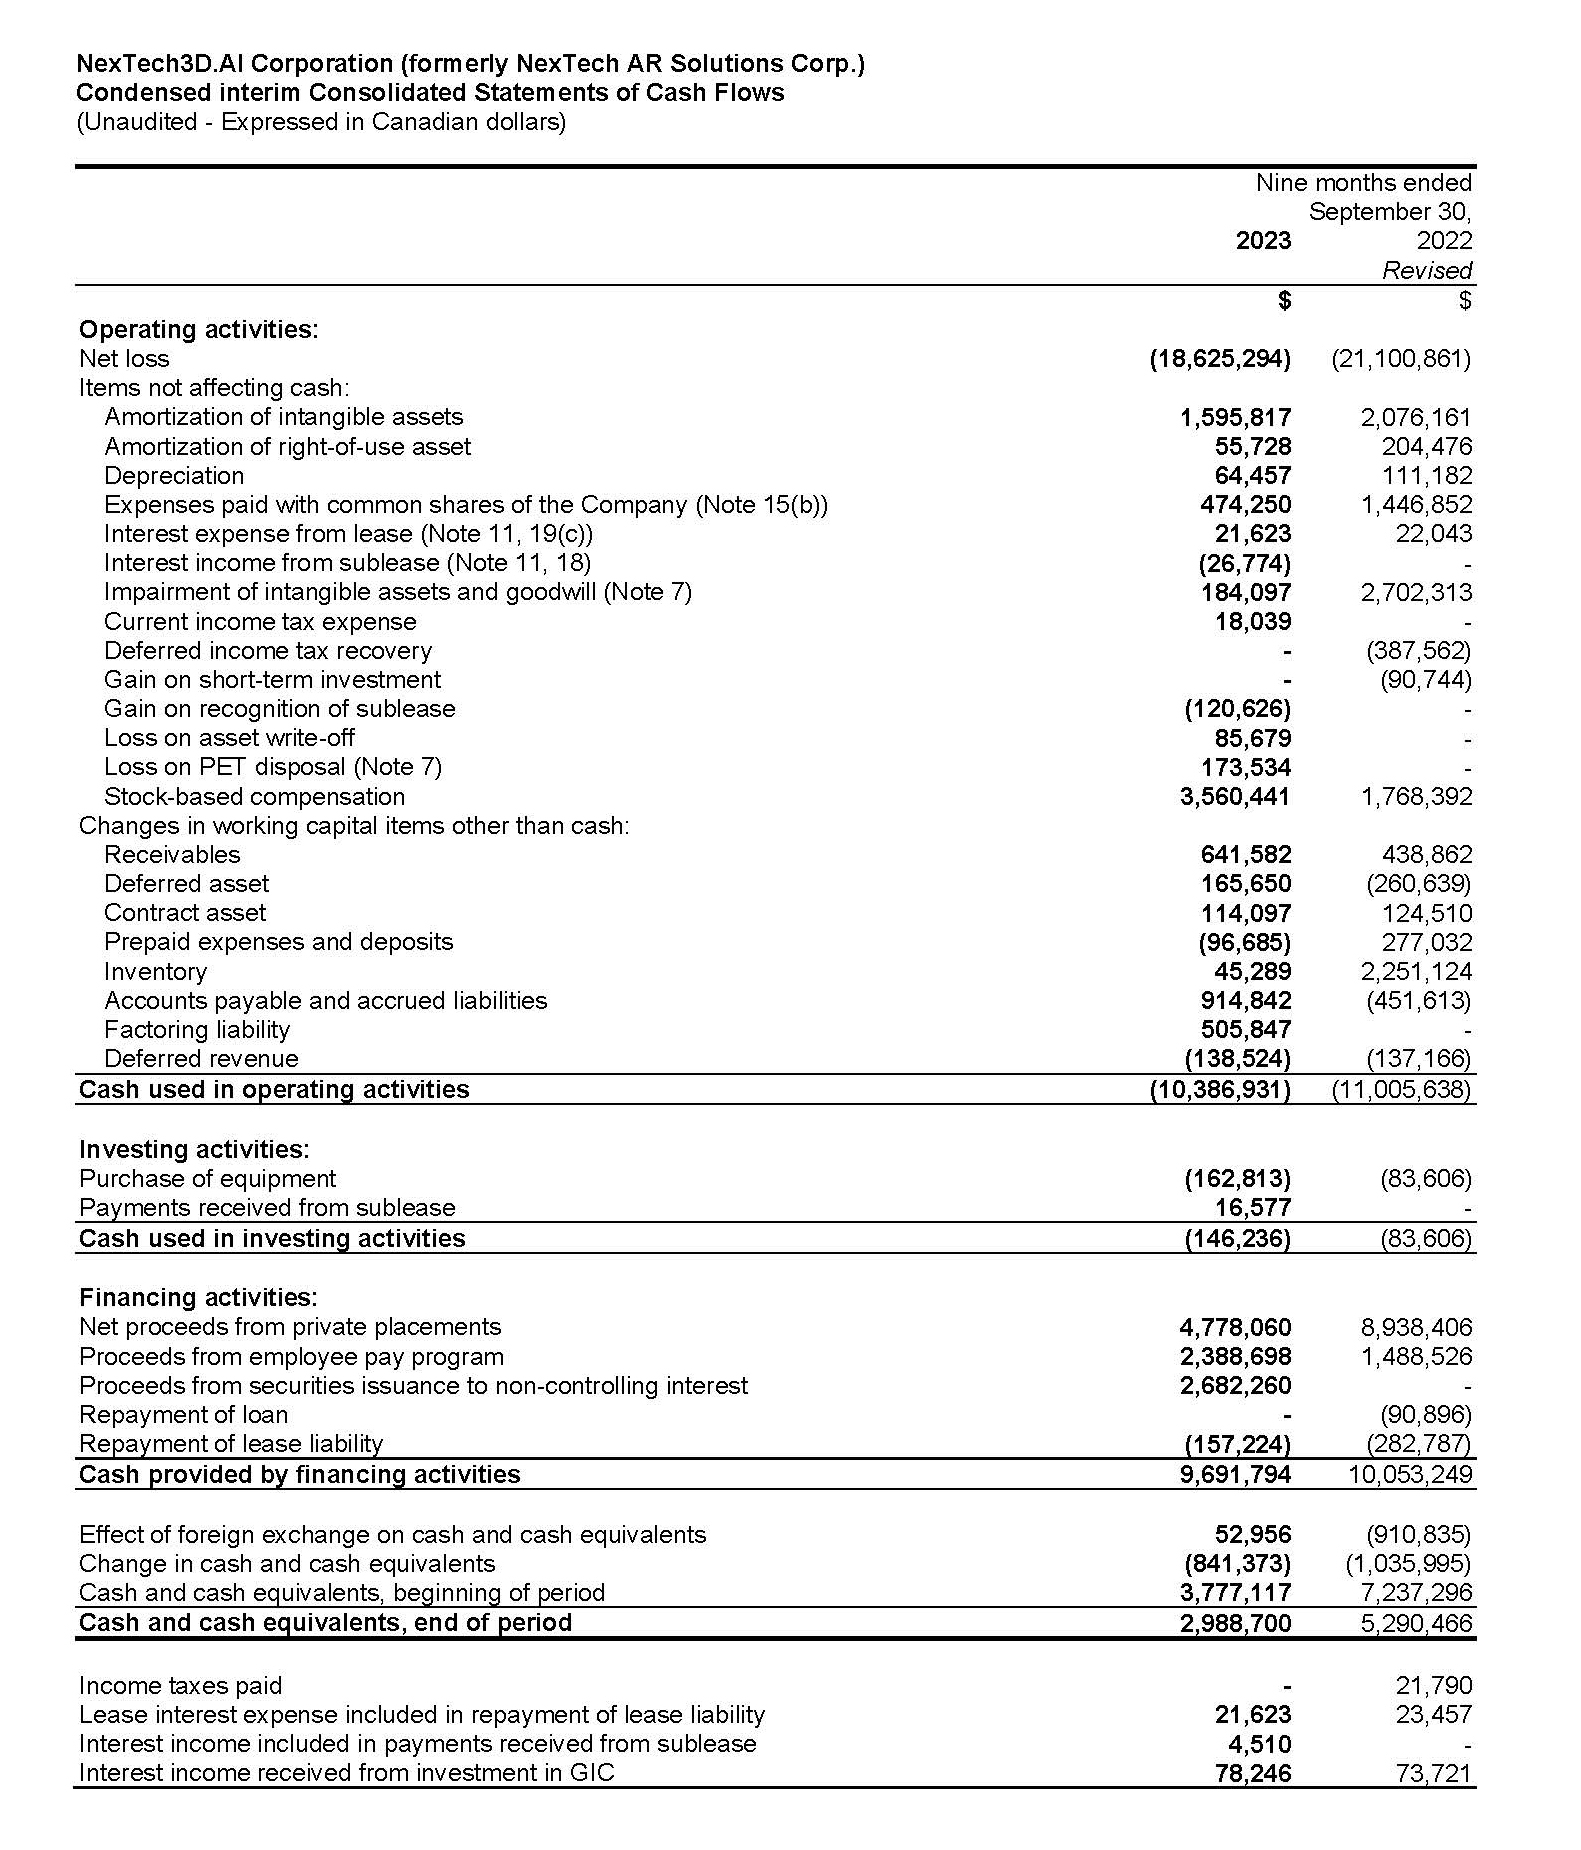
Condensed Consolidated Interim Statements of Cash Flows
| YTD | ||||||||
| 30-Sep-23 | 30-Sep-22 | |||||||
Operating activities: | ||||||||
Net loss | (18,625,294 | ) | (21,100,861 | ) | ||||
Items not affecting cash | ||||||||
Amortization of intangible assets | 1,595,817 | 2,076,161 | ||||||
Amortization of ROU | 55,728 | 204,476 | ||||||
Depreciation of property and equipment | 64,457 | 111,182 | ||||||
Expenses paid by shares | 474,250 | 1,446,852 | ||||||
Interest expense from lease | 21,623 | 22,043 | ||||||
Interest income from sublease | (26,774 | ) | - | |||||
Impairment of intangible assets & goodwill | 184,097 | 2,702,313 | ||||||
Income tax expense (recovery) | 18,039 | - | ||||||
Deferred tax expense (recovery) | - | (387,562 | ) | |||||
Gain on short-term investment | - | (90,744 | ) | |||||
Gain on sublease recognition | (120,626 | ) | - | |||||
Loss on asset disposal | 85,679 | - | ||||||
Loss on PET disposal | 173,534 | - | ||||||
Stock based compensation | 3,560,441 | 1,768,392 | ||||||
Changes in non-cash working capital balances | ||||||||
Receivables | 641,582 | 438,862 | ||||||
Deferred asset | 165,650 | (260,639 | ) | |||||
Contract asset | 114,097 | 124,510 | ||||||
Prepaid expenses | (96,685 | ) | 277,032 | |||||
Inventory | 45,289 | 2,251,124 | ||||||
Accounts payable and accrued liabilities | 914,842 | (451,613 | ) | |||||
Factor liability | 505,847 | - | ||||||
Deferred revenue | (138,524 | ) | (137,166 | ) | ||||
Total operating cash flow | (10,386,931 | ) | (11,005,638 | ) | ||||
Cashflows from investing activities | ||||||||
Purchase of equipment | (162,813 | ) | (83,606 | ) | ||||
Payments received from sublease | 16,577 | - | ||||||
Net cash provided by (used in) investing activities, continuing operations | (146,236 | ) | (83,606 | ) | ||||
Cashflows from financing activities | ||||||||
NTAR - Net proceeds from private placements | 4,778,060 | 8,938,406 | ||||||
NTAR - Proceeds from Employee Pay Program | 2,388,698 | 1,488,526 | ||||||
Proceeds from securities issuances to NCI | 2,682,260 | - | ||||||
Repayment of loan | - | (90,896 | ) | |||||
Payments of lease liability | (157,224 | ) | (282,787 | ) | ||||
Net cash provided by (used in) financing activities, continuing operations | 9,691,794 | 10,053,249 | ||||||
Effects of foreign exchange on cash | 52,956 | (910,835 | ) | |||||
Change in cash during the period | (841,373 | ) | (1,035,995 | ) | ||||
Cash, beginning of period | 3,777,117 | 7,237,296 | ||||||
Cash, end of period | 2,988,700 | 5,290,466 | ||||||
Taxes paid | - | 21,790 | ||||||
Interest paid | 21,623 | 23,457 | ||||||
Interest received from sublease | 4,510 | - | ||||||
Interest received from GIC | 78,246 | 73,721 | ||||||
Earnings Call Details:
Participant Details:
For those unable to join the live event, a recording of the presentation will be posted on the Company's Investor Relations website.
Sign up for Investor News and Info -Click Here
About Nextech3D.ai
Nextech3D.ai or the "Company," (OTCQX:NEXCF)(CSE:NTAR)(FSE:EP2), is a versatile augmented reality and AI technology company that utilizes its proprietary artificial intelligence (AI) to craft immersive 3D experiences at scale for E-COMMERCE. The Company's primary focus lies in creating high-quality 3D WebAR photorealistic models for Amazon and various other online retailers. Nextech3D.ai has adopted a unique approach to creating shareholder value beyond its operating business of creating 3D models.
The Company also develops or acquires disruptive AI-technologies, which are subsequently spun out to shareholders as standalone public companies. This spin-out strategy allows Nextech3D.ai to issue stock dividends to its shareholders while maintaining significant ownership in the public spin-out, without dilution to the parent company Nextech3D.ai.
Notably, Nextech3D.ai successfully spun out "ARway," (OTCQB:ARWYF)(CSE:ARWY)(FSE:E65) its spatial computing platform, as a standalone public company on October 26, 2022. The Company retains a 49% stake with 13 million shares in ARway Corp. while distributing 4 million shares to Nextech shareholders.
Similarly, Nextech3D.ai accomplished its second spin-out launching Toggle3D.ai, (OTCQB:TGGLF)(CSE:TGGL)(FSE:Q0C ) an AI-powered 3D design studio aimed at competing with Adobe. The Company retains a 44% stake with 13 million shares in Toggle3D.ai Corp.
To learn more, please follow us on Twitter, YouTube, Instagram, LinkedIn, and Facebook, or visit our website: https://www.Nextechar.com.
For further information, please contact:
Investor Relations Contact
Julia Viola
This email address is being protected from spambots. You need JavaScript enabled to view it.
Nextech3D.ai
Evan Gappelberg
CEO and Director
866-ARITIZE (274-8493)
Forward-looking Statements
The CSE has not reviewed and does not accept responsibility for the adequacy or accuracy of this release.
Certain information contained herein may constitute "forward-looking information" under Canadian securities legislation. Generally, forward-looking information can be identified by the use of forward-looking terminology such as, "will be" or variations of such words and phrases or statements that certain actions, events or results "will" occur. Forward-looking statements regarding the completion of the transaction are subject to known and unknown risks, uncertainties and other factors. There can be no assurance that such statements will prove to be accurate, as future events could differ materially from those anticipated in such statements. Accordingly, readers should not place undue reliance on forward-looking statements and forward-looking information. Nextech will not update any forward-looking statements or forward-looking information that are incorporated by reference herein, except as required by applicable securities laws.


| Last Trade: | US$0.10 |
| Daily Change: | 0.002 2.04 |
| Daily Volume: | 57,300 |
| Market Cap: | US$22.160M |
November 18, 2025 November 07, 2025 November 07, 2025 October 30, 2025 October 28, 2025 | |


